Danfoss Workflow Optimization Project
Duration: ~2 months (Spring 2021)
Team size: 4 students
Role: UX Research (interviews, analysis, synthesis, and co-presenter)
Tools & methods: Semi-structured interviews, KJ method, affinity mapping, insight synthesis
Project Context
This project was part of a professional apprenticeship module during my Master’s program, carried out in collaboration with Danfoss. The company had recently been working on a new internal software platform and wanted to better understand how custom orders were being processed across their different global factories.
While Danfoss produces standardized units, almost every order required a certain degree of customization, and the way this was handled varied widely between regions. Our task was to talk with people involved in this process, learn how things actually worked day-to-day, and identify what wasn’t working as intended. The findings would then help inform the rollout of their new system and improve internal workflows.
I naturally can’t go into much detail about the specific systems or processes involved, out of respect for the NDA I signed and the trust Danfoss placed in us. However, I can speak about the methodology and the approach we took, and what I in turn learned from working on a project of this scale and complexity.
My Role
Since we were a small group of four, we shared most responsibilities evenly. from conducting and transcribing interviews to organizing data and preparing the final presentation. I took part in several international interviews, including factories in Mexico, East Asia, and Denmark. I also helped present our results to Danfoss stakeholders and executives, which was an exciting opportunity to see our insights discussed at a strategic level.
While we all contributed across stages, I naturally gravitated toward analysis and structure and figuring out how to make sense of the data we collected and turn it into something actionable. I also found a lot of energy in communicating those insights clearly to others in our presentation.
Remote Ethnography in Practice
Because this project took place during COVID-19, and also due to the international nature of our research, all of our interviews and workshops were conducted remotely. That meant we couldn’t rely on some classic ethnographic methods like workplace observation. Instead, we had to recreate a sense of presence through digital collaboration tools. Using Microsoft Teams and Miro, we designed interactive interview sessions where participants could visually map their own workflows, pain points, and improvements directly in real time.
Surprisingly, many participants found this approach engaging, even refreshing. A few mentioned they expected a more formal, questionnaire-style interview but ended up enjoying the hands-on format, as it helped them express ideas and reflect more deeply on their work.
Conducting our research this way taught me a lot about the possibilities and capabilities of how digital ethnography and how it can uncover meaningful insights, even without being physically present. It also taught me how to guide conversations and workshops in a virtual space, and taking advantage of several exciting digital tools.
Approach: Using the KJ Method
The KJ method was prescribed to us by our professor as a way to familiarize ourselves with qualitative synthesis techniques. Early on, we experimented with different ways of structuring the data. At first we considered using symbols or different fonts assigned to each interview for quick reference, but that quickly became messy and hard to interpret at a glance.
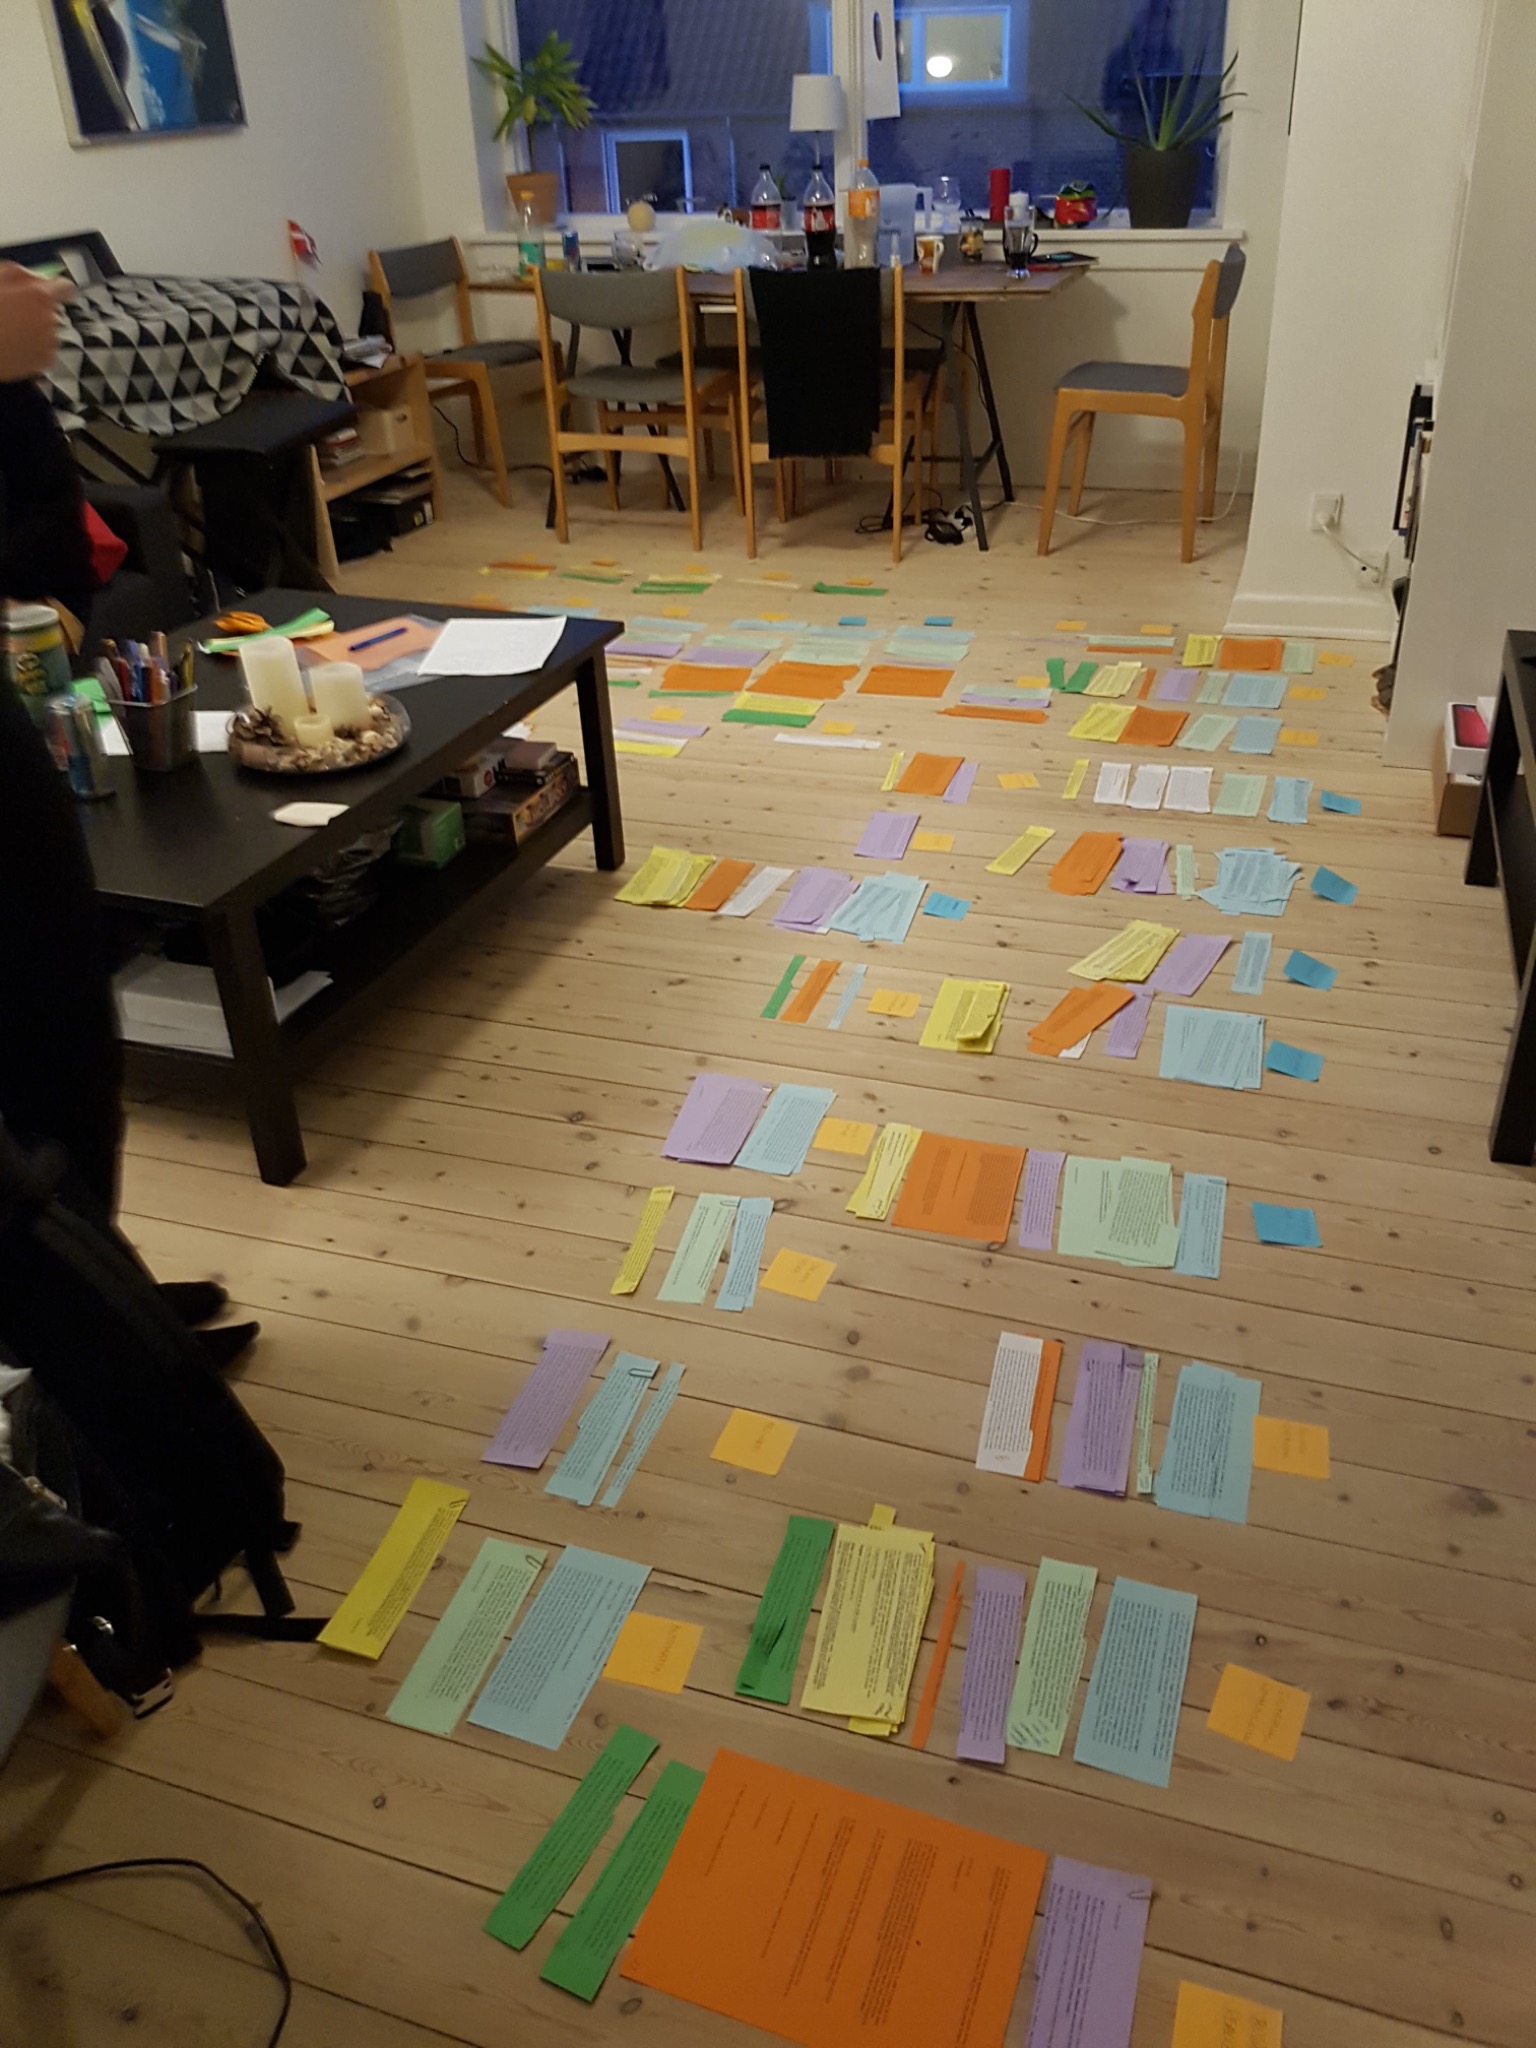
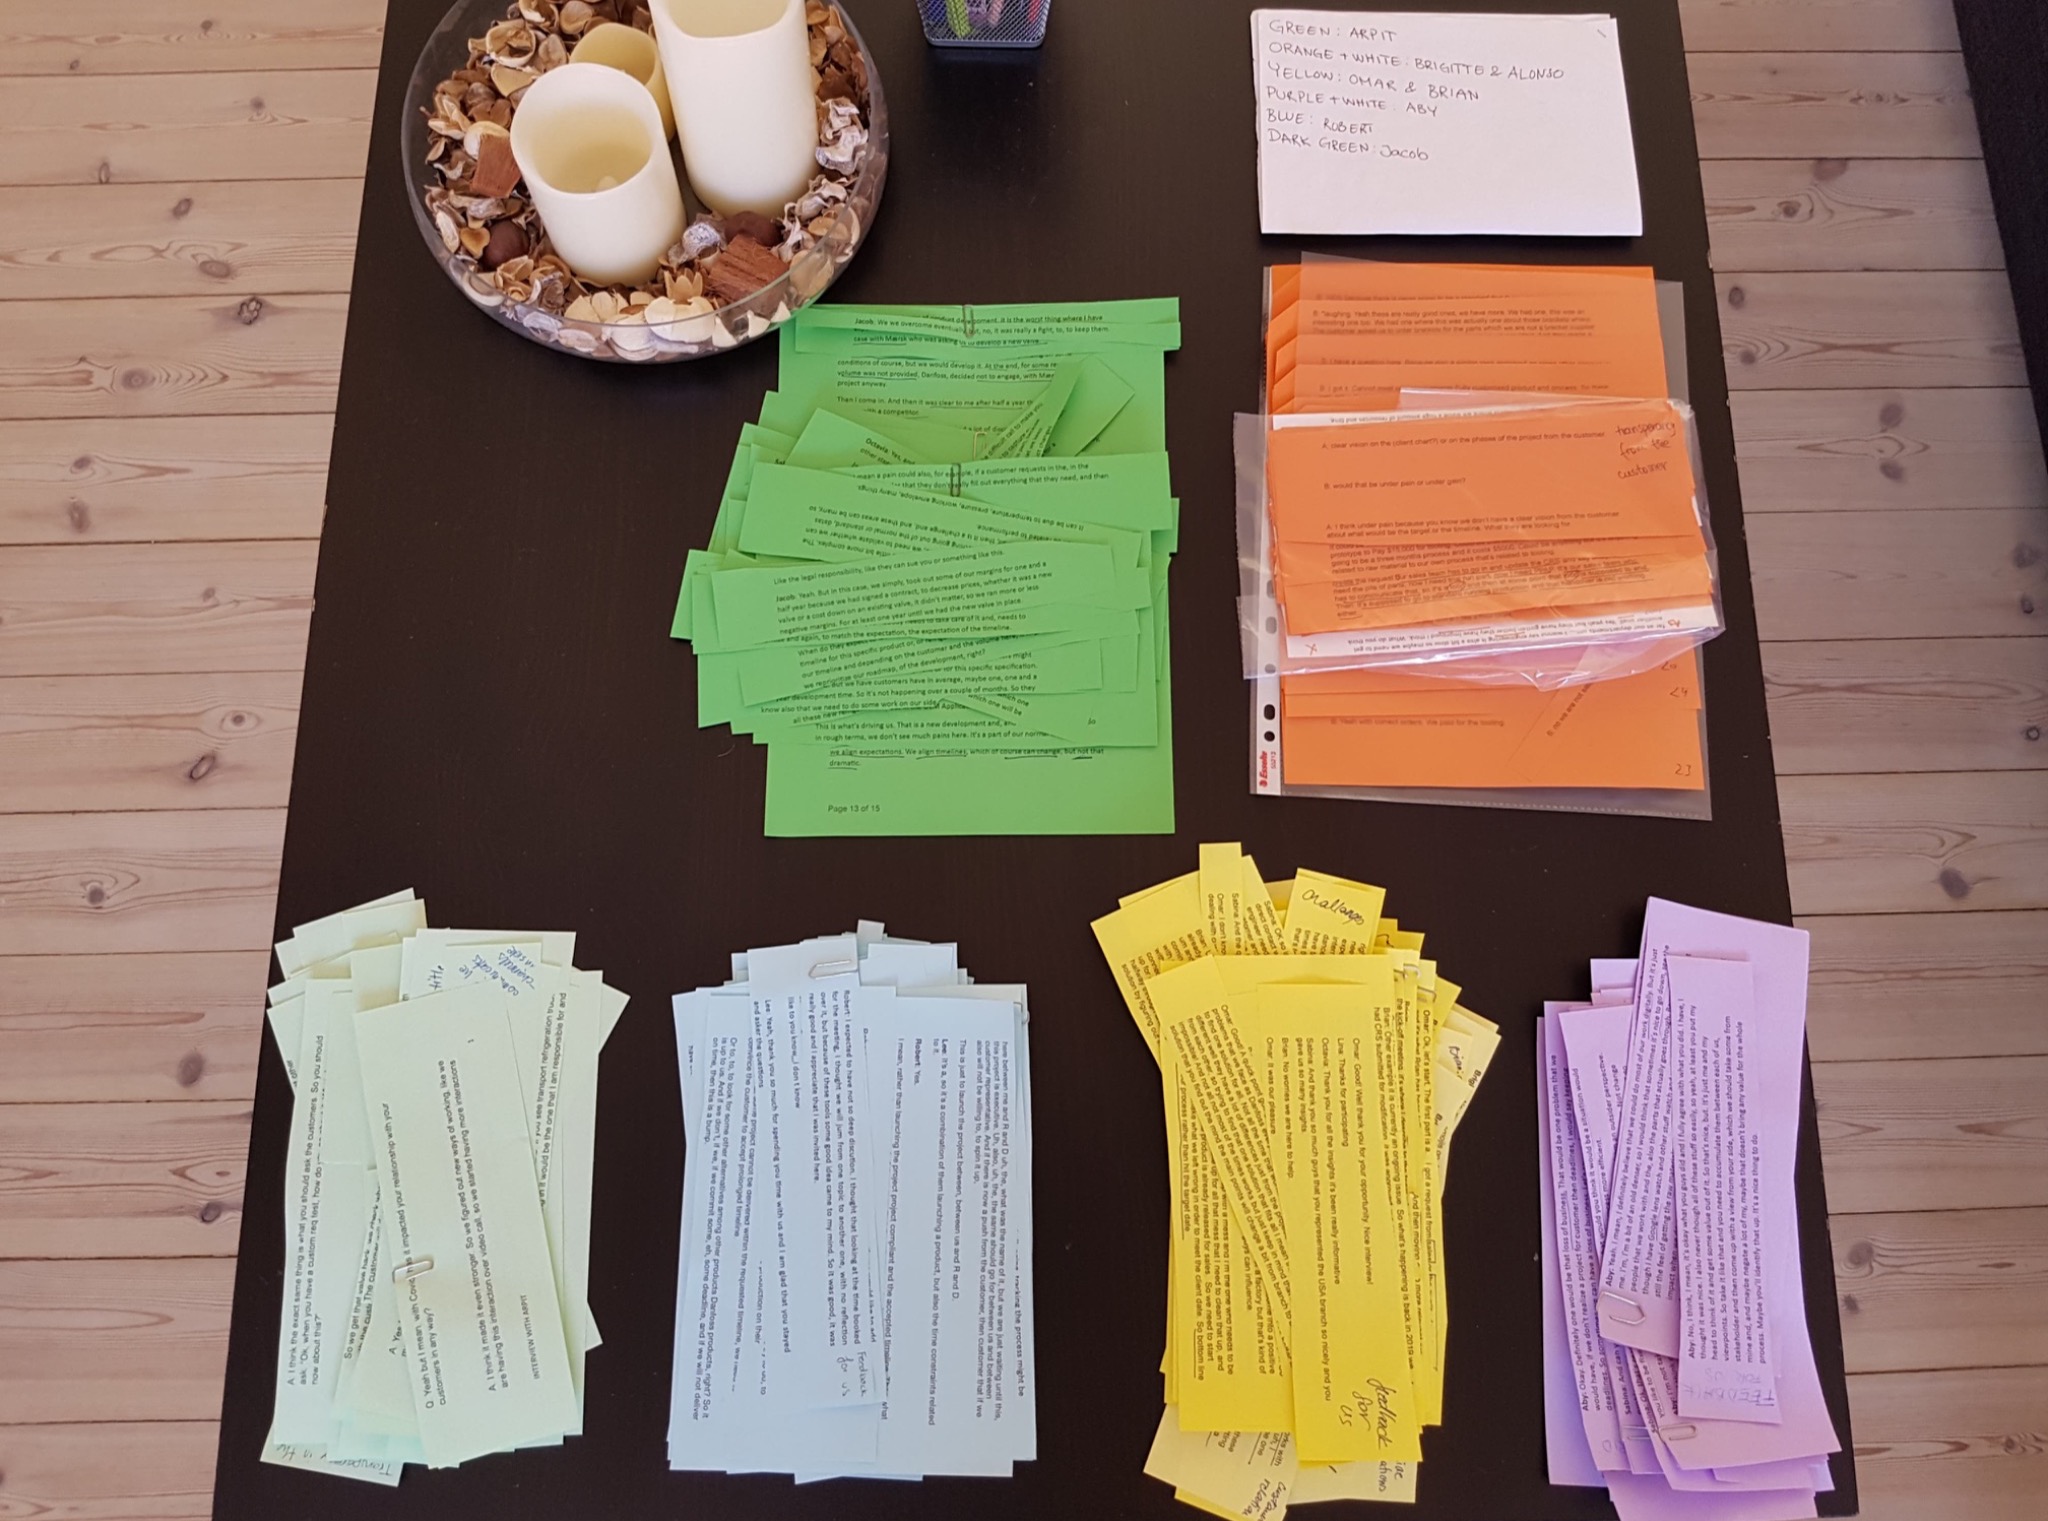
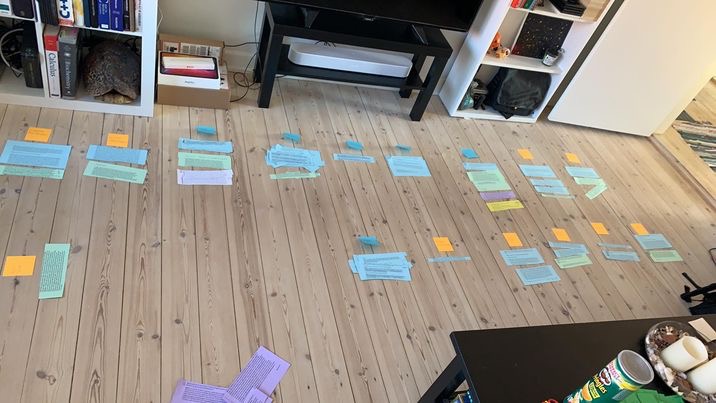
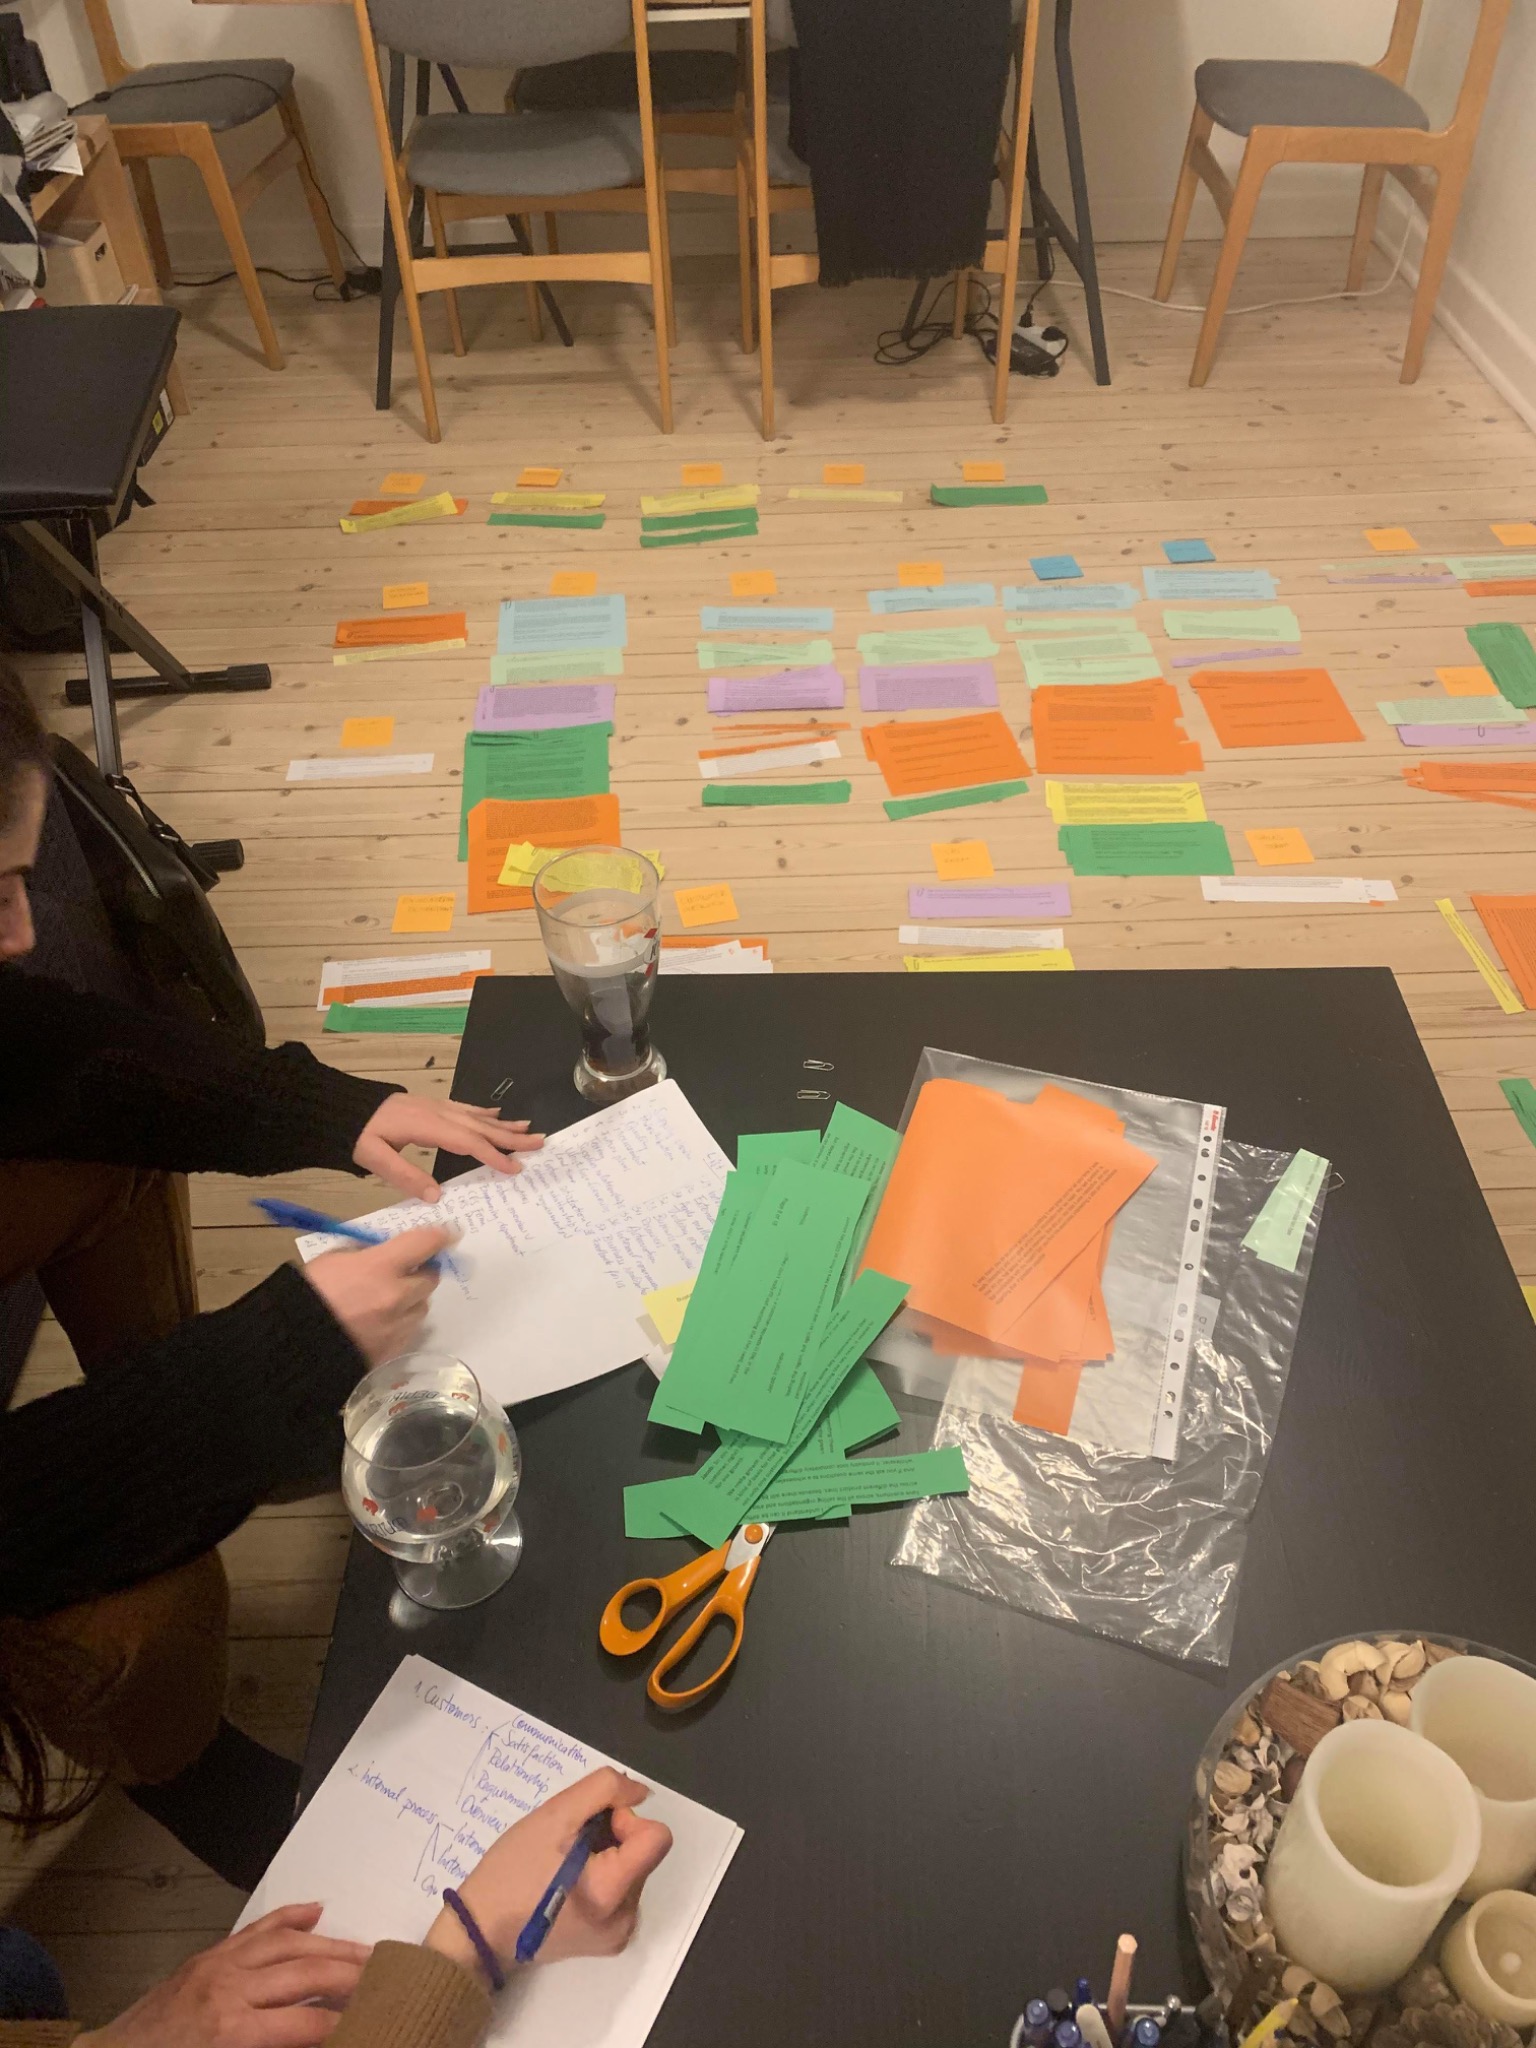
After some trial and error, we decided to color-code each interview. This gave us both an immediate overview and a way to trace each insight back to its original source. It also made the analysis surprisingly tangible as we literally spread everything out across a living room floor and started moving pieces around.
We transcribed all the interviews ourselves, partly due to NDAs and data security, and partly because we didn’t have access to the transcription tools that are more readily available today. It was time-consuming, but it also forced us to engage deeply with every line of conversation. Although it was the part I enjoyed the least, it did force a level of immersion that helped us retain a higher degree of nuance and context in our research.
Once everything was printed and color-coded, we followed the KJ method step by step: grouping similar statements, then grouping those groups again, each time summarizing what they represented in a short sentence. It was fascinating to watch the data gradually distill itself into patterns and key insights. Seeing meaning emerge from what first felt like chaos was one of the most valuable lessons I took from the project.
Outcome
The final presentation was primarily delivered directly to key Danfoss stakeholders, not to our university supervisors. For them we had a separate deliverable more focused on our methodology and on how we had grown as researchers. We outlined how the current order workflow functioned in reality, how it differed between regions, and what the biggest friction points were. We also proposed several conceptual improvements based on our findings.
The feedback we received showed us how useful it was for them to see a neutral breakdown of internal pain points, especially one that compared perspectives company-wide across sites.
Reflections
This project taught me a lot about the value of hands-on, collaborative research and how structure can bring clarity to even the most complex data. I also learned that while the KJ method is great for small-to-medium projects, as I feel it would quickly become impractical for larger ones, (at least within our time frame) but the philosophy behind it, and the value of respecting the data in the way that the KJ method does has stuck with me
Most of all, it taught me how much I enjoy being part of that process where messy, qualitative stories start forming into clear patterns and where insights begin to emerge.
Gallery
0 Comments Add a Comment?